
Power BI Business Central Reports: 15 Examples on Performance, Usage, and Errors
Power BI Business Central reports enable tracking, visualizing, and measuring key metrics of an information system. More and more companies are adopting these modern Business Intelligence and Data Visualization tools, in addition to Business Central telemetry, to optimize the proactivity of their IT services, reduce emergency interventions, and thus enable them to provide high-value-added services.
Microsoft Dynamics 365 Business Central and Power BI: Automation at the Service of IT Service Proactivity and Serenity
In recent years, Microsoft has developed many solutions to increase the automation of tasks, the functional coverage, and the fluidity of the entire business process supported by the ERP Business Central. The time saved allows end-users (from finance, sales, purchasing, project and production management, etc.) to focus on high-value-added tasks.
What about internal IT services? What automated tools are offered to functional support or technical support to optimize their use of the ERP and the IT system? We will see that they have not been forgotten!
Power BI Business Central Reports in 3 Categories: Performance, Usage, and Errors
In the ERP Microsoft Dynamics 365 Business Central, there is a “somewhat hidden” part that allows configuring Power BI reports to measure several metrics of the information system. It is divided into 3 categories:
-
Performance: to have a comprehensive view of the system’s responsiveness
-
Usage: to assess the level of usage of screens and identify the most used features. This allows for a precise vision of critical flows and measuring the ROI of developed features.
-
Errors: to be alerted in real time about errors encountered by users. These reports help increase the proactivity of support teams and understand training needs.
15 Examples of Power BI Views
Performance
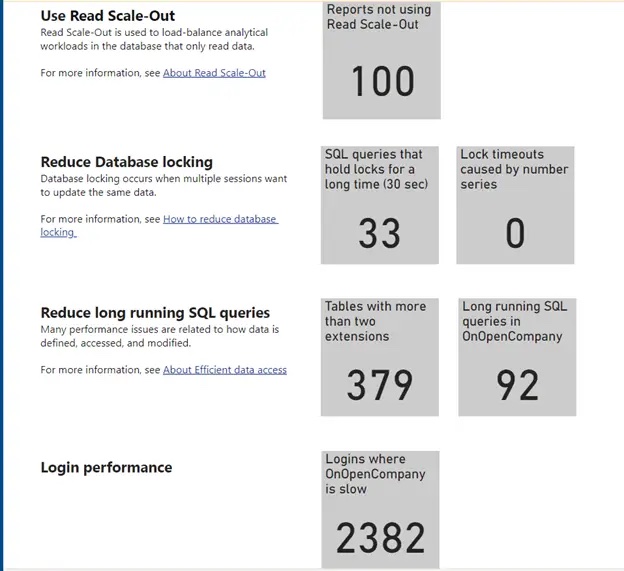 |
Dashboard: a synthetic view of system performance |
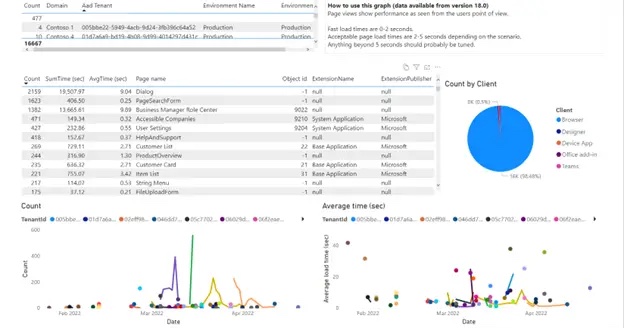 |
Most Consulted Screens with Average Display Time: the most used screens must be fast and optimized, indicating which ones need work. |
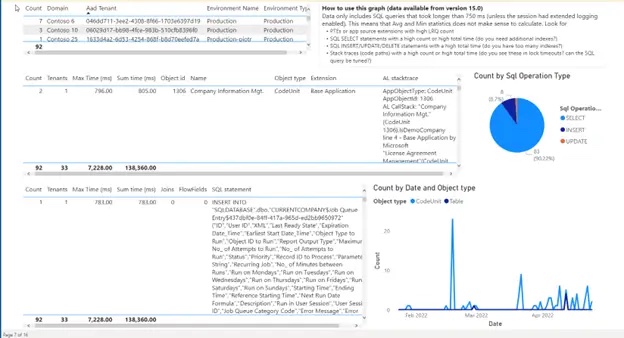 |
Volume of Slow Queries on the Database: slow queries can block users; it is possible to anticipate optimizations before blockages occur. |
Usage
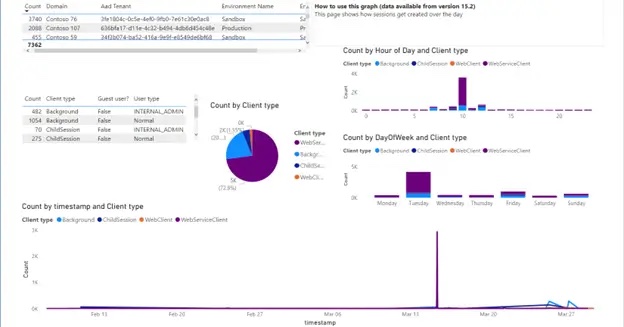 |
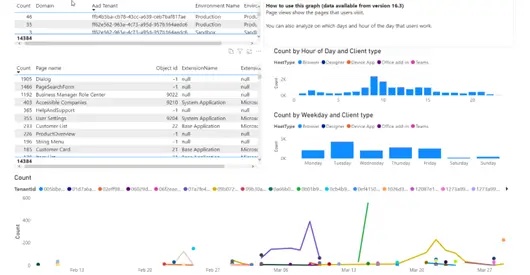
User Session Analysis: know the volume of active users on the system; this allows for determining load peaks over the week |
 |
Page Consultation: know the most used screens to deduce critical flows |
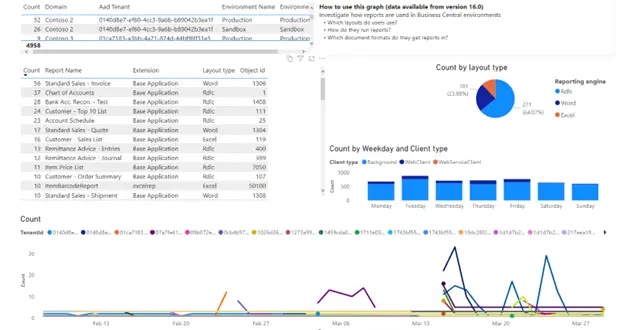 |
Use of Editions: know the most and least used editions. |
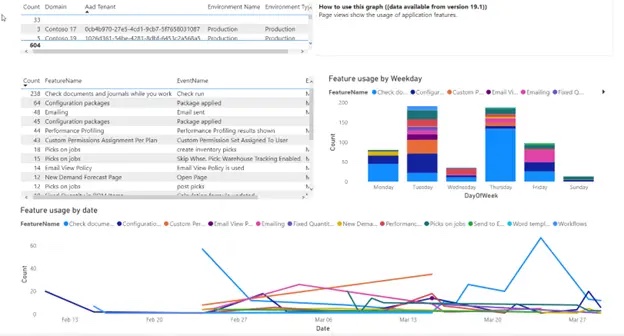 |
Feature Usage: know the functions/modules used on the ERP; this is an argument for prioritizing investments (in case of requests for evolution) and the opportunity to detect features that are not used to their full value. |
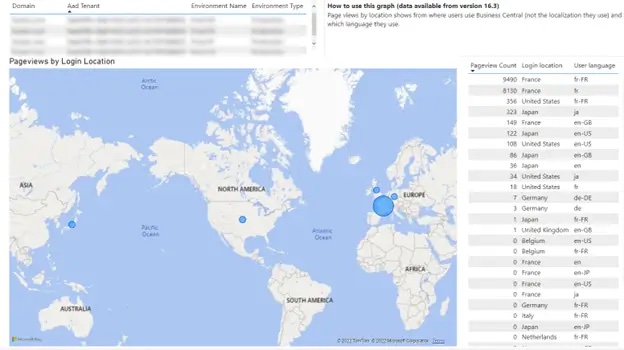 |
User Location: analyze user locations and languages used on the system. |
Errors
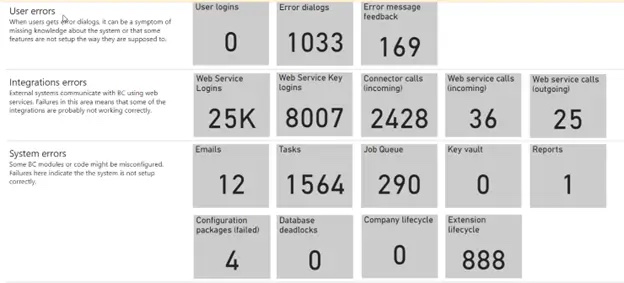 |
Dashboard: an overview of errors occurred on various technical flows (user, system2system, editions, update installation) |
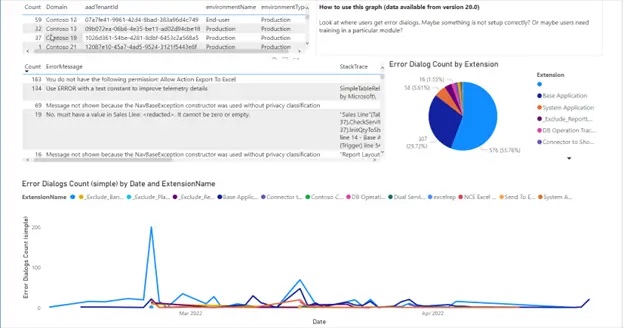 |
User Errors: learn about errors encountered by users; this allows for being proactive in solving their problems (“Should I adjust the configuration?”, “Schedule a training?”) |
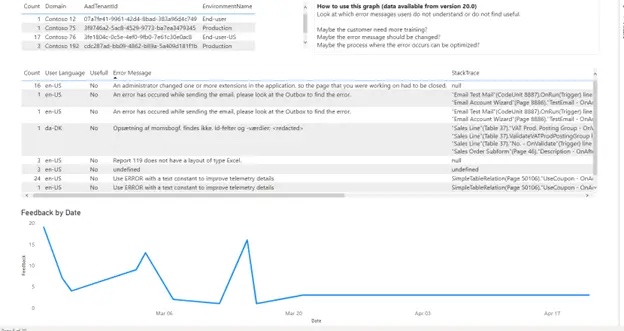 |
Error Message Evaluation: review feedback on errors, which users find useful |
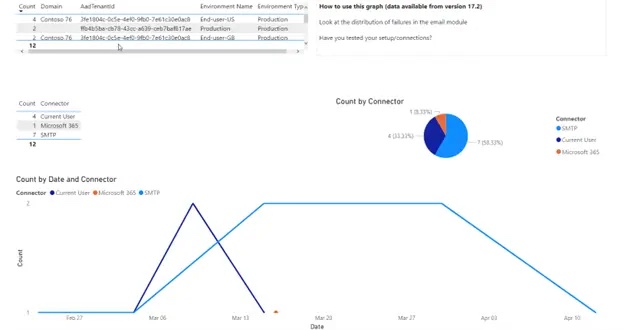 |
Errors in Email Sendings: detect communication problems to the outside; this avoids a situation where an employee thinks they have sent an email externally, but it does not work. |
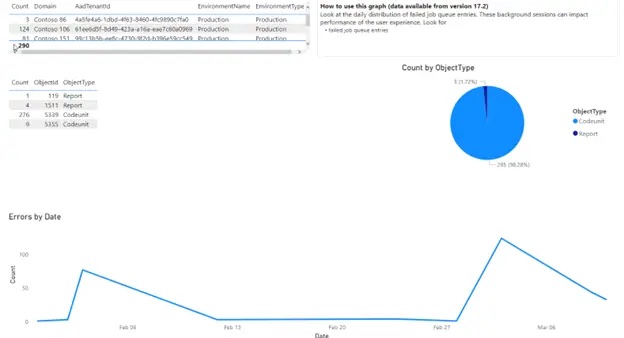 |
Automated Process Error Tracking: generally, a broken automation does not make noise… Now, there is a tool to simply monitor it. |
 |
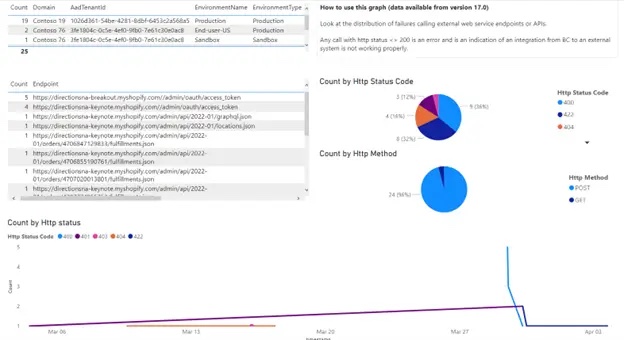
Monitoring Incoming Flows: monitor external connections on Business Central and alert external partners in case of issues. |
 |
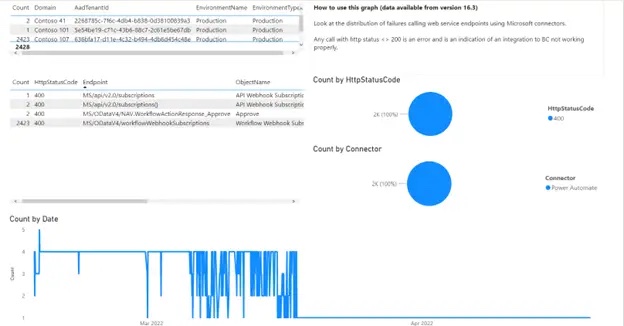
Monitoring Outgoing Flows: monitor outgoing interfaces and proactively alert external partners in case of issues. |
These tools make the daily life of IT services easier. They work with serenity, save time in problem analysis, and undoubtedly improve their proactivity towards business teams.
This saved time is precious, IT experts can reinvest it in optimizing the information system. With Business Central Cloud, it is possible to build IT processes with high Business value using Power Automate, Power Apps, Power BI, and the Azure platform.
Leave a comment